2016 Opening Weekend Series: RC @ HB

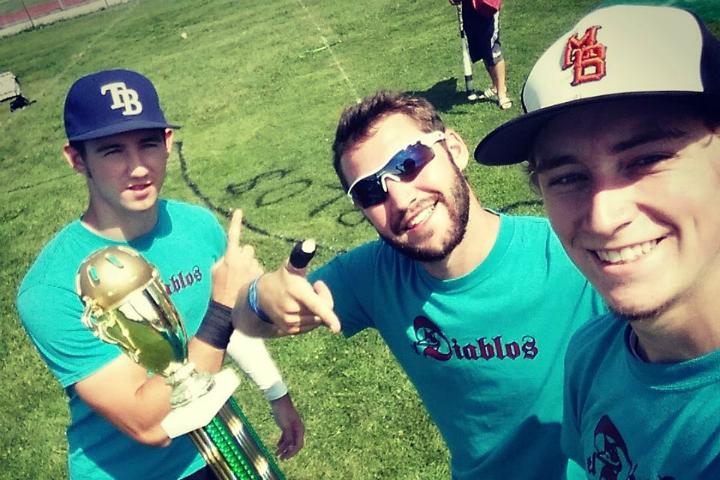
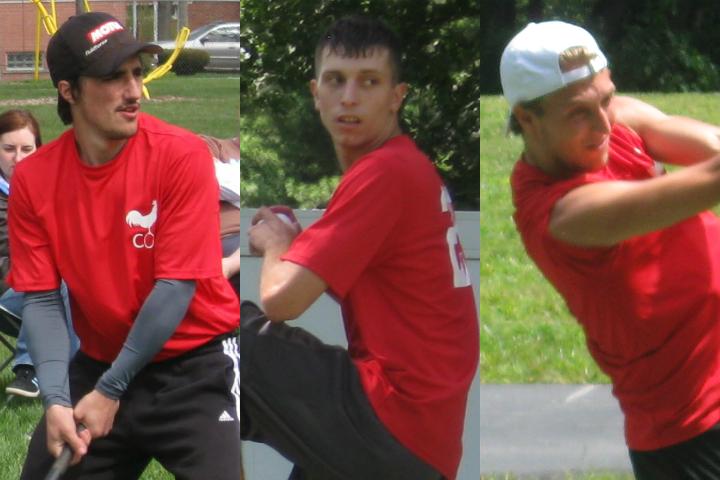
Aside from the strong double entendre of their names, the Cox and Balls share a few more things in common than you might think. For starters, the founding captains of both teams had come off strong regular season finishes only to be eliminated in the first round of the playoffs. Chris Paquin (Holy Balls) and the Mattseals ended the 2012 season on a 12-6 run, only to be swiftly sent home by the Aces. Stephen Werner (Red Cox) and 2013 King Friday won 12 straight games to close out the regular season; then promptly they were sent packing by El Diablos. A second commonality is what the captains did in their first year with their team. The Holy Balls posted an 18-10 record when they debuted in 2013; that record is closely mirrored by the Red Cox inaugural 2015 season, finishing 17-11.

The Balls hot start to the 2015 season, an Opening Weekend sweep of El Diablos, was the first time a WSEM team was ever pushed to the #1 NWLA ranking. The Balls' reign at the top was short lived, however, as they were knocked out of the top-50 teams after being swept by the Cox in week 2 — a performance which sent the Cox to 3-1 and their first NWLA top-50 ranking. Both games of that first meeting were hard fought barnburners, ultimately being decided by walk-off singles to the left-side of the field after many scoring chances in earlier innings had vaporized.

The final line on their 2015 season series was a 3-1 advantage for the Cox, who outscored the Balls 7-4 over the four games. Neither team ever plated more than 3 runs against the other in a game — the Balls set that high water mark with their lone win. In fact, the average runs scored per game — by both teams combined — was only a meager 2.75.

2016 Opening Weekend Series: EL @ IS

Turnabout:
El Diablos and the Islanders both joined WSEM in 2013. Historically speaking, the fighting chickens were the team finishing well above .500 (.750 in '13, .714 in '14), while the black-and-white pirates fell well short of that mark (.176 in '13, .143 in '14). However, 2015 saw both teams break in the other direction. El Diablos had their first sub-.500 finish; the Islanders jumped .300 point in the standings and made the playoffs for the first time.

2015 Opening Weekend:
We got a sharp taste of change right out of the gate in 2015. The Islanders opened up in surprising fashion, going 2-0 and piling up 19 RS against the Wolfpack. El Diablos on the other hand were swept in their Opening Day series by the Holy Balls, including a bitter extra innings defeat in the second game.

Head-to-Head:
El Diablos bats proved superior in the higher scoring games, winning 8-3 and 11-7. Speaking of that 11-7 win, this was the teams' first meeting of the season and accounted for more than half the runs scored in the entire season series (18 of 33). The Islanders battled out two 1-run victories (their first ever against El Diablos) in a pair of pitchers duels for their part: 2-1 and 1-0.

2016 Opening Weekend Series: SY @ FS

Small World:
This series between the See Yas and Flying Squirrels pits one of WSEM's newest franchises against one its oldest, respectively. For the 2016 season the Squirrels have appointed the third captain in team history, Dylan Braden. This will be Braden's first stab at a captaincy. He has been around from the very beginning of WSEM just like the Squirrels, so it is fitting for such a storied franchise to now be in his veteran hands. On the visiting bench we have this image in reverse. Ryan Alexia broke into WSEM with the Flying Squirrels on Opening Day 2012 before forming the See Yas in 2015. It's a small wiffle world.

Head-to-Head:
The Squirrels and See Yas both had a 6-run win against each other in 2015. Both teams also recorded a shut out win against the other in 2015. The See Yas' shut out victory came on a game-winning, ninth inning home run. The Squirrels' shut out victory was 3 runs better in regulation, giving them a 14-11 advantage in runs scored in the series.

Ace-vs-Ace:
Both teams are returning their number-one pitchers: Craig Skinner for the Squirrels, Stephen Farkas for the See Yas - two of only three pitchers to throw perfect games in 2015. Skinner's 2015 perfecto came in week one, game one, where he silenced the Ringler Division champion Aces. Farkas' perfecto came in week eight against the Garcia Division champion Wolfpack.

2016 Opening Weekend Series: WP @ WA

Our first announced Opening Weekend series for 2016 is the obvious one: Wolfpack at Wicked Aces. The 2015 division champions will clash to kick off the new season. We'll save the surprises for later.

New Regimes:
Holding the title of returning champion isn't the only thing the Aces and 'Pack have in common, either. Both teams reassigned their captaincy this offseason. Austin Bischoff has retaken the leadership role for the Aces after sitting out the 2015 season. Meanwhile, Greg Brannan takes the reins of the Wolfpack from his brother, Mark Brannan, in what will be his first foray as a WSEM team captain.

History is One-Sided:
Greg's first test with his team will be a big one. The Aces have thoroughly dominated the head-to-head series with the Wolfpack, going 6-0 over two seasons of play while outscoring the Wolfpack 65-5 in those games. In fact, the Austin-led Aces did not surrender a single run to the Wolfpack in 2014.

Last Opening:
Opening Weekend 2015 saw shaky starts by both teams. Wolfpack pitching struggled with their control and lost two games to the Islanders by a combined 15 runs. The Aces fared better overall, splitting their set with the Squirrels, but were on the wrong end of a perfect game in the first contest of the year.

Top 10 Pitchers All-Time in WSEM History (by David Castle)

10)Trey Jardine
0.82 ERA | 1.06 WHIP | 15.65 K/6 | 4.05 BB/6 | 3.86 K/BB
He’s only spent 2 years in WSEM, but he’s had 2 very solid, efficient years. Being the only elite lefty pitcher in WSEM, he gives hitters a different look at the dish which makes him so effective.
  9)Chris Paquin
3.07 ERA | 1.46 WHIP | 10.76 K/6 | 2.35 BB/6 | 4.58 K/BB
He’s had over 100 Ks every year he has pitched. What makes him so unique is that he gets guys out without throwing very hard at all. He’s very crafty and efficient. He struggled in 2015, but will rebound in 2016 without a doubt.
  8)RJ Fisher
0.60 ERA | 1.02 WHIP | 14.87 K/6 | 4.55 BB/6 | 3.27 K/BB
When he actually shows up to games, he can dominate. He probably throws the second fastest in the league, with a unique over the top release point, which makes him untouchable at times. I even heard he made a man bleed.
  7)Dennis Pearson
3.60 ERA | 2.06 WHIP | 15.75 K/6 | 9.99 BB/6 | 1.58 K/BB
In 2011 he had 233 strikeouts, a total that no one thought would ever be broken. He dominated WSEM in 2011 and 2012, but since then his accuracy has declined dramatically, making him a borderline #2 arm.
  6)Sam Hatt
1.18 ERA | 1.08 WHIP | 14.24 K/6 | 3.96 BB/6 | 3.59 K/BB
He won’t blow you away with heat, he just knows how to pitch. He has 2 perfect games to his name as well. Before the mound was moved back, his drop ball was nearly unhittable and possibly one of the nastiest pitches in WSEM history.
  5)Chandler Phillips
1.68 ERA | 1.36 WHIP | 14.80 K/6 | 6.35 BB/6 | 2.33 K/BB
A strikeout machine. He can duel with anyone in the league. He’s been plagued with poor accuracy at times, which actually helps him out more than you’d think. He has 634 career punch-outs and has improved his season total every year. He’s my pick for 2016 Clown Shu.
  4)Evan Bischoff
0.59 ERA | 0.68 WHIP | 14.09 K/6 | 2.00 BB/6 | 7.06 K/BB
If only he didn’t stand in his brother’s shadow. Evan has tallied up 4 very impressive years in WSEM, including one perfect game, but the most impressive feat is the fact that he’s only given up 15 runs in 4 years… hitters beware.
  3)Craig Skinner
0.58 ERA | 0.76 WHIP | 15.10 K/6 | 3.14 BB/6 | 4.81 K/BB
Despite his 3 career perfect games, he is often overlooked. He can deal with the best of them. Even though he hasn’t had much success on the national level, he has no problem carving up WSEM bats with relative ease… unless there’s rain.
  2)Stephen Farkas
0.30 ERA | 0.39 WHIP | 16.65 K/6 | 1.42 BB/6 | 11.72 K/BB
Possibly the best clean ball wiffleball pitcher… ever? He’s only been in the league for 2 years and has made a name for himself nationally. In that timespan he has FIVE perfect games, throwing 4 in 2014 alone. As long as he doesn’t blow out his arm (knock on wood), he’ll continue his dominance.
  1)Austin Bischoff
0.35 ERA | 0.79 WHIP | 16.49 K/6 | 3.79 BB/6 | 4.35 K/BB
The only reason I put him above Farkas is because he’s been around longer and dominant all along. He has 2 perfect games to his name and has a career 0.26 ERA to go along with a 0.78 WHIP, he didn’t play in 2015, but looks to come back with a vengeance in 2016.
Honorable Mention:
0.82 ERA | 1.00 WHIP | 15.00 K/6 | 4.00 BB/6 | 3.75 K/BB
1.86 ERA | 1.21 WHIP | 13.91 K/6 | 4.29 BB/6 | 3.24 K/BB
2.39 ERA | 1.53 WHIP | 13.89 K/6 | 5.90 BB/6 | 2.35 K/BB
1.43 ERA | 1.31 WHIP | 14.77 K/6 | 5.72 BB/6 | 2.58 K/BB
2.62 ERA | 1.53 WHIP | 14.32 K/6 | 6.74 BB/6 | 2.12 K/BB

Winter Meeting Policy Decisions and Notes

  1. New Strike Zone Size:  28" high x 20" wide, set 10" off the ground. New boards will be clear plexiglass with painted edges to better accommodate the view of cameras behind the plate.

  2. Defensive Alignment and Roster Size:  3 fielders behind the pitcher and 8-player rosters remain for the 2016 season. However, starting in 2017 max roster size will decrease to 6 players. The number of players needed to be playoff eligible will also decrease from 6 to 4 in 2017.

  3. Substitute players may only be fielded if 4 or less roster players are available for the game. This grants a team a full defensive complement plus 1 extra player to utilize.

  4. Oversight for Final Calls:  Initial calls still made by players in the game. If the call made on the field is disputed, then a majority decision of the crowd with a view of the play will make final call.

  5. Divisions will be realigned for the 2016 season. The Wolfpack and Wicked Aces will remain in Garcia and Ringler, respectively, but the remaining team spots will be randomly selected.

  6. A new form of dead ball zone will be tested at the second satellite tournament to address concerns raised over the number of 20' hits. No decision has been made to adopt this change during the season.
Bonus: Watch the post-meeting scrimmage played between the "Rebels" and the "Empire" in the Hart Plaza ampitheater here.

2016 Core Rosters: Career Hitting Numbers

EL DIABLOS PA AB BB H TB SF AVG OBP SLG
 LaDouceur 469 352 116 96 219 1 .273 .452 .622
 C. Phillips 665 537 126 128 252 2 .238 .382 .469
 Tomlinson 662 508 152 169 299 2 .333 .485 .589
TEAM:  1796 1397 394 393 770 5 .281 .438 .551
SQUIRRELS PA AB BB H TB SF AVG OBP SLG
 D. Braden 719 603 114 160 336 2 .265 .381 .557
 Brown 160 126 34 22 33 0 .175 .350 .262
 Skinner 488 406 80 109 181 2 .268 .387 .446
TEAM:  1367 1135 228 291 550 4 .256 .380 .485
HOLY BALLS PA AB BB H TB SF AVG OBP SLG
 Fisher 332 284 47 57 96 1 .201 .313 .338
 Paquin 649 488 160 98 159 1 .201 .398 .326
 Pearson 730 643 86 198 435 1 .308 .389 .677
TEAM:  1711 1415 293 353 690 3 .249 .378 .488
ISLANDERS PA AB BB H TB SF AVG OBP SLG
 Doby 205 156 49 28 54 0 .179 .376 .346
 Giguere 112 85 27 22 40 0 .259 .438 .471
 Linebrink 615 488 124 108 177 3 .221 .377 .363
TEAM:  932 729 200 158 271 3 .217 .384 .372
RED COX PA AB BB H TB SF AVG OBP SLG
 Haffey 268 208 60 36 56 0 .173 .358 .269
 Kujawa 147 120 26 22 44 1 .183 .327 .367
 Werner 288 231 57 71 143 0 .307 .444 .619
TEAM:  703 559 143 129 243 1 .231 .387 .435
SEE YAS PA AB BB H TB SF AVG OBP SLG
 Alexia 420 294 124 33 38 2 .112 .374 .129
 Corbett 741 594 144 138 254 3 .232 .381 .428
 Farkas 347 298 48 76 136 1 .255 .357 .456
TEAM:  1508 1186 316 247 428 6 .208 .373 .361
WICKED ACES PA AB BB H TB SF AVG OBP SLG
 A. Bischoff 452 351 100 100 185 1 .285 .442 .527
 E. Bischoff 543 445 96 108 172 2 .243 .376 .387
 Bortmas 578 419 156 158 309 3 .377 .543 .737
TEAM:  1573 1215 352 366 666 6 .301 .456 .548
WOLFPACK PA AB BB H TB SF AVG OBP SLG
 G. Brannan 434 322 112 97 195 0 .301 .482 .606
 Fejza 124 106 18 21 31 0 .198 .315 .292
 Strojny 262 212 50 48 91 0 .226 .374 .429
TEAM:  820 640 180 166 317 0 .259 .422 .495
PRE-DRAFT RANKINGS IN 3 MAIN OFFENSIVE STAT CATEGORIES
AVERAGE
WICKED ACES   .301
EL DIABLOS   .281
WOLFPACK   .259
FLYING SQUIRRELS   .256
HOLY BALLS   .249
RED COX   .231
ISLANDERS   .217
SEE YAS   .208
ON-BASE %
WICKED ACES   .456
EL DIABLOS   .438
WOLFPACK   .422
RED COX   .387
ISLANDERS   .384
FLYING SQUIRRELS   .380
HOLY BALLS   .378
SEE YAS   .373
SLUGGING %
EL DIABLOS   .551
WICKED ACES   .548
WOLFPACK   .495
HOLY BALLS   .488
FLYING SQUIRRELS   .485
RED COX   .435
ISLANDERS   .372
SEE YAS   .361

Celebrate the Strikeout


A big swing and a miss! If WSEM used a silhouette logo in the style of MLB, it would have to be this. Why would a league celebrate a swinging strike? Well, that image perfectly captures what you'll see around here more often than not. "Yup, this is literally WSEM," acknowledged our own Evan Bischoff. Strikeouts aren't even something to be ashamed of when playing a game designed to give the pitcher every advantage. Sure, you could look at the numbers and say, "we suck!" Or just as fairly, you could come to the conclusion that the pitching is just too good. And that is definitely a commodity worth celebrating.

We've always thought of WSEM hitting numbers as "behind the curve." To assess the reality of that situation we've grabbed the 2015 numbers for 12 other leagues, plus Major League Baseball and the NWLA Tournament, to see exactly where we sit in the wiffleball landscape. To do this we're looking at two key stats: 1) league batting average, and 2) hits per strikeout recorded. Leagues were selected through a combination of notoriety and ease of pulling up the required stats. The numbers put up by each league are laid out in the table below.
BATTING AVG:   .202
Hits per SO:   0.33
(Errors not recorded)
BATTING AVG:   .254
Hits per SO:   1.12
(Adjusted for errors)
BATTING AVG:   .271
Hits per SO:   1.20
BATTING AVG:   .243
Hits per SO:   0.52
(Adjusted for errors)
BATTING AVG:   .259
Hits per SO:   0.56
BATTING AVG:   .283
Hits per SO:   0.62
(Errors not recorded)
BATTING AVG:   .439
Hits per SO:   1.49
(Errors not recorded)
BATTING AVG:   .362
Hits per SO:   1.60
(Errors not recorded)
BATTING AVG:   .365
Hits per SO:   0.91
(Errors not recorded)
BATTING AVG:   .255
Hits per SO:   0.81
(Adjusted for errors)
BATTING AVG:   .267
Hits per SO:   0.84
BATTING AVG:   .330
Hits per SO:   1.46
(Errors not recorded)
BATTING AVG:   .310
Hits per SO:   1.01
(Errors not recorded)
BATTING AVG:   .354
Hits per SO:   1.51
(Adjusted for errors)
BATTING AVG:   .374
Hits per SO:   1.59
BATTING AVG:   .254
Hits per SO:   0.49
(Errors not recorded)
BATTING AVG:   .333
Hits per SO:   1.16
(Adjusted for errors)
BATTING AVG:   .358
Hits per SO:   1.24
BATTING AVG:   .425
Hits per SO:   1.41
(Errors not recorded)
BATTING AVG:   .401
Hits per SO:   2.37
(Errors not recorded)
First things first: It's true. Our league batting average and hits per strikeout recorded are significantly lower than any of the leagues in this comparison. Palisades WBL comes the closest in both categories: scoring only marginally better in H/K (+0.13), but still hitting much better overall with a 0.52 advantage in AVG. The NWLA Tournament is the only closer mark for AVG, but we might be able to blame our bats being involved for shrinking that gap [The Dads hit .237 this year].

Second things second: You'll notice that some of the sampled leagues include an "Adjusted for errors" correction made to their final numbers. WSEM does not score errors in our league games; if a fielder bobbles an easy ball, that's a hit. So, to put everything on a level plain we need to count the "errors" recorded in leagues that use them as hits. Obviously, this results in the gap widening even more.

After looking at these numbers, it's clear we can proudly own the "big swing and a miss" silhouette. I say "proudly" because this sport was crafted for pitchers, and clearly we're doing well in that part of the game. All told, 5 of 13 leagues (including WSEM) on this list had more strikeouts than hits in 2015 - and OCWA and TBW pitchers could easily make that number 7 had they played a fast-pitch style this year. I like when it falls that way. Sure, it would be nice to have the league average a bit further away from the Mendoza line (and we'll discuss one or two ways of doing that this winter), but the hits feel best when they're fought for and earned; when you know you've overcome something impressive; when there is some long-awaited, vehemently plotted vengeance involved. And that's why you shouldn't be ashamed of the strikeout.
Veteran Player Registration
Rookie Player Registration
* Any player with < 60 PA is classified as a rookie

Offseason Notes & Schedule


2016 player registration is now open, and will remain open to veterans until February 27th, one week before the 2016 Auction Draft. Rookies may continue to register after this date. All players must register to be eligible to join a 2016 roster.

◦  Important Offseason Dates  ◦
December 1st — Deadline for any changes to team names, logos, or colors for the 2016 season. All changes are subject to league approval.

December 12th — Winter Meeting. Captains or team representatives highly encouraged to attend; any interested players also invited. Will discuss and vote on rule changes for the 2015 season and beyond.

February 20 — 4th Annual Slow in the Snow Tournament. 3-on-3 underhand slow pitch, no baserunning.

March 5th — 2016 Auction Draft. Each team must leave the auction with at least 6 rostered players, forming their core for 2016. Both veterans and rookies are available to draft. Preview each team's situation heading in.

March 19th — Satellite Tournament #1

April 2nd-8th — Rookie Supplemental Draft. Changed from last year, now only rookies are available in the supplemental draft. Undrafted veterans must wait for the Week 1 waiver wire to be claimed.

April 9th — Satellite Tournament #2

April 19th — Deadline to announce Opening Day rosters. Must include at least 6, but no more than 8 players.

April 30th — Opening Day. All 8 teams in action playing in a 2-game series.

2016 Franchise Tags and Remaining Salary Caps

EL DIABLOS
Captain: Franchise 1: Franchise 2:
Chandler Phillips ($45) Kyle Tomlinson ($35) Dakota LaDouceur ($20)
Trade-In Cap Space $ per Draft Pick
$0 $110 $36.67
Cap Hit
$0
FLYING SQUIRRELS
Captain: Franchise 1: Franchise 2:
Dylan Braden ($30) Craig Skinner ($50) Ray Brown ($30)
Trade-In Cap Space $ per Draft Pick
$0 $100 $33.33
Cap Hit
$0
HOLY BALLS
Captain: Franchise 1: Franchise 2:
Chris Paquin ($20) RJ Fisher ($35) Dennis Pearson ($45)
Trade-In Cap Space $ per Draft Pick
$13 $113 $37.67
Cap Hit
$10
ISLANDERS
Captain: Franchise 1: Franchise 2:
Alex Linebrink ($25) Kevin Doby ($35) Michael Giguere ($35)
Trade-In Cap Space $ per Draft Pick
$45 $160 $53.33
Cap Hit
$0
RED COX
Captain: Franchise 1: Franchise 2:
Stephen Werner ($40) Scott Kujawa ($45) Kiefer Haffey ($30)
Trade-In Cap Space $ per Draft Pick
$47 $142 $47.33
Cap Hit
$0
SEE YAS
Captain: Franchise 1: Franchise 2:
Ryan Alexia ($10) Stephen Farkas ($50) Brandon Corbett ($30)
Trade-In Cap Space $ per Draft Pick
$50 $134 $44.67
Cap Hit
$36
WICKED ACES
Captain: Franchise 1: Franchise 2:
Austin Bischoff ($50) Evan Bortmas ($50) Evan Bischoff ($50)
Trade-In Cap Space $ per Draft Pick
$0 $50 $16.67
Cap Hit
$10
WOLFPACK
Captain: Franchise 1: Franchise 2:
Greg Brannan ($40) Travis Strojny ($45) Dash Fejza ($25)
Trade-In Cap Space $ per Draft Pick
$11 $86 $28.67
Cap Hit
$25

Evolution of Pitching Rotations Under the Cap

2013 TEAM PITCHING ROTATION PERFORMANCE
TEAM IP K BB K/BB KPI WHIP KPI-WHIP FINISH
WA  121.0 307 96 3.20 2.54 1.07 1.41 1
EL  126.2 303 147 2.06 2.39 1.61 0.78 2
WW  121.2 261 104 2.51 2.15 1.64 0.51 4
HB  131.2 260 155 1.68 1.97 2.28 -0.31 3
DU  113.0 277 253 1.09 2.45 2.48 -0.39 6
KF  154.2 293 207 1.42 1.89 2.44 -0.55 5
BW  132.1 209 146 1.43 1.58 2.94 -1.36 8
IS  125.1 258 276 0.93 2.06 3.71 -1.65 7
WSEM  1026.1 2168 1384 1.67 2.11 2.32 -0.21
2013 Only 3 of 8 team pitching rotations have a sub-2.00 WHIP and a positive KPI-WHIP (37.5%). Top 4 pitching teams take the four playoff spots. #Chalk
2014 TEAM PITCHING ROTATION PERFORMANCE
TEAM IP K BB K/BB KPI WHIP KPI-WHIP FINISH
WA  169.2 423 110 3.85 2.50 0.96 1.54 1
EL  176.0 408 119 3.43 2.32 1.07 1.25 2
BW  180.1 441 139 3.17 2.45 1.30 1.15 4
FS  139.2 360 168 2.14 2.58 1.80 0.77 5
ON  126.0 272 90 3.02 2.16 1.41 0.75 7
WW  115.0 233 106 2.20 2.03 1.70 0.33 6
HB  158.2 332 178 1.87 2.09 1.89 0.20 9
KF  139.0 296 181 1.64 2.13 1.94 0.19 3
WO  133.1 208 271 0.77 1.56 3.38 -1.32 8
IS  93.1 165 171 0.96 1.77 4.20 -2.43 10
WSEM  1430.2 3138 1533 2.05 2.19 1.82 0.38
2014 8 of 10 team pitching rotations have a sub-2.00 WHIP and a positive KPI-WHIP (80%). Top 4 pitching teams make playoffs, but the number 8 pitching rotation plays its way in. #Darkhorse
2015 TEAM PITCHING ROTATION PERFORMANCE
TEAM IP K BB K/BB KPI WHIP KPI-WHIP FINISH
RC  169.2 409 116 3.53 2.41 1.14 1.27 2
WA  145.1 337 84 4.01 2.32 1.12 1.20 1
SY  169.2 360 99 3.64 2.13 1.46 0.67 8
FS  172.2 407 183 2.22 2.36 1.69 0.67 3
WO  167.2 343 161 2.13 2.05 1.56 0.49 4
EL  152.0 318 179 1.78 2.09 1.96 0.13 6
HB  176.2 367 181 2.03 2.08 2.06 0.02 6
IS  157.2 325 195 1.67 2.06 2.06 0.00 5
WSEM  1310.0 2866 1198 2.39 2.19 1.64 0.55
2015 6 of 8 team pitching rotations have a sub-2.00 WHIP (75%), but all 8 teams post a non-negative KPI-WHIP (100%). The number 8 pitching rotation plays its way into the playoffs along with the top 2 and numbers 4 and 5. #Parity
Evidently, the performance of pitching rotations around the league has come closer and closer over the years. There is no bad rotation to speak of from the 2015 season. Today's number 8 rotation would fit in the top 4 two years ago. Every staff is now dealing more strike outs than they are allowing walks or hits, and there is no longer a single team far removed from the numbers put up by the rest of the league. This has created a world where the eighth best rotation is good enough to be a playoff team. Every rotation is now throwing in playoff contention. For a deeper look at parity, just compare the average run differential of playoff teams and the shrinking divide of runs allowed over the past 3 years:

2013 2014 2015
Average Run Differential of Playoff Teams   82.8 48.6 27.4
Difference Between High & Low Runs Allowed   253 266 101
Standard Deviation of Runs Allowed   76.8 78.6 33.7
Average run differential of playoff teams reduced by 58.6% in 2014 with the introduction of the talent cap, then reduced by another 56.4% in 2015 with the salary cap. Read: "Blowouts and domination are dwindling." The salary cap also closed the gap between the highest and lowest runs allowed by a pitching rotation, decreasing it to less than 40% of either preceding year. The standard deviation of runs allowed across the league saw similar reduction by nearly 60% from the previous seasons. #GettingThere

Team Salary Cap Situations: Before Franchise Decisions

EL DIABLOS SQUIRRELS HOLY BALLS ISLANDERS RED COX SEE YAS WICKED ACES WOLFPACK
Initial Cap:  $210 $210 $210 $210 $210 $210 $210 $210
Trade In:  $0 $0 $13 $45 $47 $50 $0 $11
Trade Out: 
 (Potential
  Cap Hit)
$0 $0 $60 $0 $0 $36 $10 $60
Lewis: $10 McKinnie: $1 Adams: $10 * Fejza: $35 *
Fisher: $50 * Fisher: $35 Bencher: $13 *
Villarreal: $12 *
Working Cap:  $210 $210 $163 $255 $257 $224 $200 $161
* Cap hit can be avoided by using franchise tag on player
El Diablos — No draft funds coming in or going out. El Diablos start with the stock working salary cap of $210. 2014 captain Chandler Phillips will cost his team $45. Likely candidates for a franchise tag: Kyle Tomlinson at $35, Nicco Lollio at $40.
Flying Squirrels — No draft funds coming in or going out. The Squirrels start with the stock working salary cap of $210. 2014 captain Michael Sessions will cost his team only $10. Likely candidates for a franchise tag: Craig Skinner at $50, Raymond Brown at $30, or Dylan Braden at $30.
Holy Balls — The Balls have $13 coming in. That is enough to cover the $10 cap hit already enforced after dropping Chris Lewis. Another $50 cap hit could be incurred if they do not franchise RJ Fisher; this is reflected in their $163 working cap. 2014 captain Chris Paquin will cost his team $20. Likely candidates for a franchise tag: RJ Fisher at $35, David Castle at $45, or Dennis Pearson at $45.
Islanders — The Islanders pocketed an additional $45 of cap space through two trades, with no potential cap hits. This gives them a working cap of $255. 2014 captain Alex Linebrink will cost his team $25. Likely candidates for a franchise tag: Kevin Doby at $35, Michael Giguere at $35.
Red Cox — The Red Cox are set up great with an additional $47 and no cap hits, giving them a working cap of $257. 2014 captain Stephen Werner will cost his team $40. Likely candidates for a franchise tag: RotY Scott Kujawa at $45, Trey Jardine at $45, or Kiefer Haffey at $30.
See Yas — The See Yas have already incurred $36 in cap hits. However, they're buoyed by an additional $50 traded in. This gives them a positive working cap of $224. 2014 captain Ryan Alexia will cost his team just $10. Likely candidates for a franchise tag: Clown Shu Stephen Farkas at $50, Brandon Corbett at $30.
Wicked Aces — The Aces face a cap hit of $10 if they do not franchise Zac Adams. With no additional money traded in the Aces start with the a working cap of $200. Austin Bischoff is expected to reclaim the captaincy and will cost his team $50. Likely candidates for a franchise tag: 2014 captain Evan Bischoff at $50, MVP Evan Bortmas at $50, or Nate Gendron at $40.
Wolfpack — The Wolfpack face pending cap hits of up to $60. $35 of this is on Dash Fejza, $13 on Jeff Bencher, and $12 on Michael Villarreal. At least one of these will be enforced; likely two. They do have $11 coming in to slightly take off the sting. 2014 captain Mark Brannan would cost his team a manageable $15, but there are rumors his brother Greg Brannan may take over; Greg would be $40 against the cap. Likely candidates for a franchise tag: MIP Travis Strony at $45, Dash Fejza at $35.
Note:  Cap hits are incurred when players received in a trade for future draft funds are not franchised. The amount of the cap hit is equal to the amount dealt in the trade.